Compare two or more ETFs, Mutual Funds, or Single Stocks.
This article was last reviewed and updated on 5/4/23
Our Compare tool allows you to analyze up to 10 securities at a time for a comparison on a broad set of data metrics.
Using the Tool
1. You can access the Compare tool by clicking the icon under Research and Analysis on the homepage, or from the Hamburger Icon drop-down list on the left side of the platform under Research and Analysis.

2. You can choose between uploading an existing portfolio/watchlist, or manually creating one inside the Compare tool. There is a slider in the top left corner of the tool to toggle back and forth between creating or loading a watchlist or portfolio.
There is also the option to upload a new portfolio or watchlist via CSV by selecting the Actions dropdown next to Load, and choosing Upload.
To create a new watchlist or portfolio, search and add your desired tickers underneath where it says Symbol in the top left corner of the tool.
 3. Once your desired securities have been inputted into the tool, press the Apply button in the top right corner.

Exploring the Data & Analytics
After running the Compare tool, you will find the following data sets which can be exported to PDF or Excel files.
Security Overview
Security Profile
- Standard overview of the security profile for each fund being compared.

Distributions
- Dividend & Yield data on all funds being compared.

Trading Statistics
- Standard trading data for each fund being compared.

Trailing Returns
- Trailing returns ranging from 1D to 10Y of each fund being compared.

Institutional Ownership
- 13F data highlighting institutional ownership of the funds being compared.

Fund Regressions
- Standard Fund Regression data for each fund being compared.

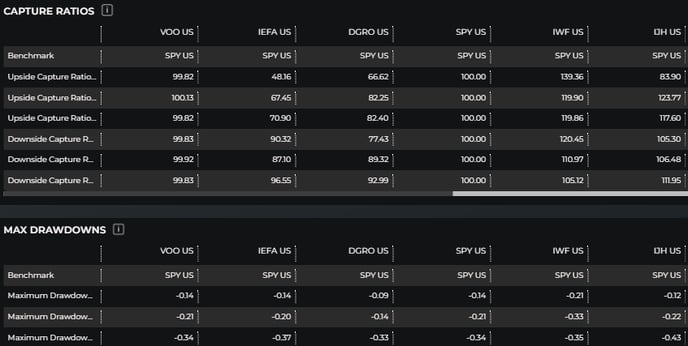
Capture Ratios & Max Drawdowns
- All data relative to Capture Ratios & Drawdowns for each fund being compared.

Charting
- Chart the performance of your selected securities or portfolio with the full toolset and dataset of our Charting Tools.

Holdings
Basket Statistics

Country Weights
- Highlights geographic exposure based on weights of listed countries throughout the holdings being compared.

Sector Weights
- This section highlights equity exposure to the various market sectors from the group of funds being compared.

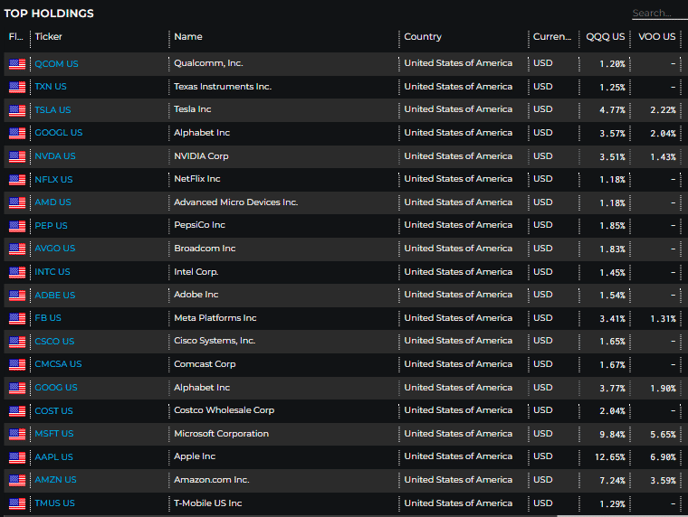
Top Holdings
- This section highlights the top holdings of each fund being compared by ticker.
