Datapoints for any Single Stock, ETF, or Mutual Fund available at the click of a button from anywhere in the platform.
This article was last reviewed and updated on 5/4/23
Security Overview is your one-stop shop for any information on a given security profile, performance, institutional ownership, and much more. Search up any security on the fly no matter where you are on the platform by utilizing the search bar located at the top of every page.
Please review our Security Overview introduction video below:
Using the Tool
 Search up any ETF, Mutual Fund, or individual stock and select from the dropdown menu search results to see an analysis of the key metrics of the selected security.
 Once you click on the desired security from the list, the tool will automatically load the outputs.
Exploring the Data & Analytics
General
- Security Profile
- Basic Charting Tool
- 1M - 10Y; Price or % Performance
Overview searches can be broken out into Portfolio Analysis or Comparison by pressing the Analyze or Compare button next to the Fund Name in the top left corner.

- Similar Funds
- Funds w/ Overlap - Same Category
- Funds w/ Overlap - Other
- Peer Group Funds
- Capture Ratios & Drawdowns
- Upside Capture Ratio (1y, 2y, 3y)
- Downside Capture Ratio (1y, 2y, 3y)
- Maximum Drawdown (1y, 2y, 3y)
- As of Date & Benchmark for Calculations
- Dividend Yields
- Dividend Payout YTD
- Dividend Yields (TTM)
- Last Price
- Latest Annual Dividends
- Latest Dividend
- Latest Ex-Date
- # of Dividends (TTM)
- Regression Analytics
- Alpha, Beta, Standard, Deviation
- Annual Return
- Variance
- Sharpe, Sortino, Information Ratios
- R-Squared
- Institutional Ownership
- Top 10 Holders based on latest 13F filings
- Trading Statistics
- Last: Daily Volume, Daily Close, Bid Price, Ask Price
- Volatility: 5-Day, 20-Day, 40-Day, 60-Day Annualized
- ADV: 5-Day, 20-Day, 40-Day, 60-Day
- Median Daily Volume 60-Day
- Max Daily Volume 60-Day
- Momentum: 20-Day, 40-Day, 60-Day
- Trailing Returns (YTD, 1d, 1w, 1m, 3m, 6m, 1y, 2y, 3y, 5y, 10y)

Advanced Chart
- Charting
- Identical functionality to our Charting Tools application, built into Overview for your convenience.

Flows
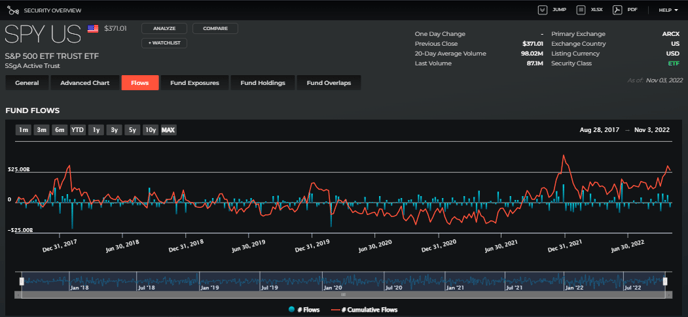
- Daily and Cumulative Fund Flows
- 1M, 3M, 6M, YTD, 1Y, 3Y, 5Y, 10Y, MAX

Fund Exposures
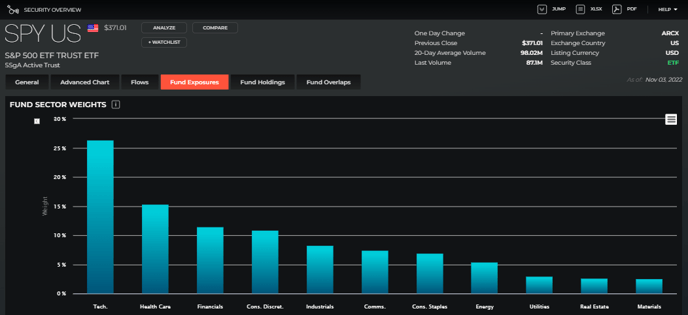
- Weights by Sector

Fund Holdings
- Top Holdings

- Basket Statistics
- Country Weights
- Sector Weights

Fund Overlaps
- Basket Overlaps - Domestic

- Basket Overlaps - International

- Basket Overlaps - Other

- Reverse Lookup - ETFs

- Reverse Lookup US Mutual Funds
