Optimize and customize inputted portfolios and compare them against the original allocation.
This article was last reviewed and updated on 11/21/22
Applies to: LOGICLY Core, Coach, Enterprise
LOGICLY's Model Maker is an optimization tool that takes an inputted portfolio and allows users to create risk-optimized adjustments based on a client's asset class allocation, income desires, and expense threshold. We give you the ability to save your optimized outputs and then compare them against one another in a breakout analysis within the application.
Using the Tool
1. You can access the Model Maker tool by either:
- Clicking the box on the top portion of the home page.
- Clicking the Hamburger Icon, scrolling down to Portfolio Tools, and selecting Model Maker.
 2. Create a new portfolio on the fly, or upload an existing portfolio from My Portfolios.
NOTE: Portfolios need to be denominated in % for Model Maker.
3. Once your portfolio of choice is loaded into the tool, press the Apply button in the top right-hand corner.

4. After the 'Apply' button is selected, the Model Maker tools will appear below your inputted portfolio.

5. Adjusting the sliders on the left-hand side will adjust the weights of the current holdings of the given asset class.

You can also click the + sign next to each asset class to adjust the weights of specific sectors or breakdowns of that asset class. If the portfolio does not contain a certain asset class, you will not be able to adjust it here.
When you adjust a slider, the tool automatically updates the weights of the selected asset class as well as the others that are represented. The updated weights are shown on the right-hand side and are color-coordinated: Green = increased weight, Red = Decreased weight. In the below example, Fixed Income weights were increased and Equity weights were subsequently decreased.
 6. Once you have created an optimization that you would like to compare against the original portfolio, You can select the 'Analyze & Compare' button at the bottom of the page.

Exploring the Data & Analytics
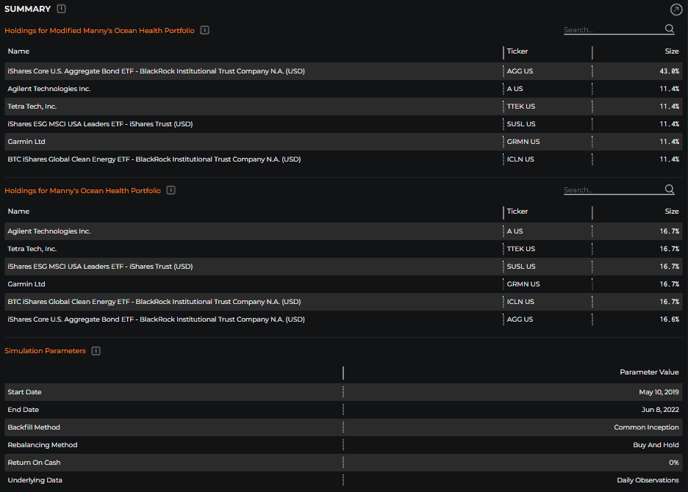
Summary
- Holdings for each Portfolio
- Simulation Parameters
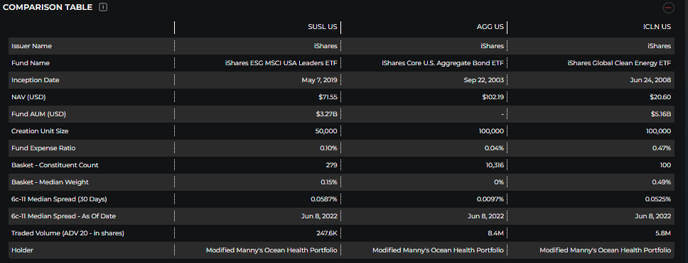
Comparison Table
- Constituent Profile Breakdown
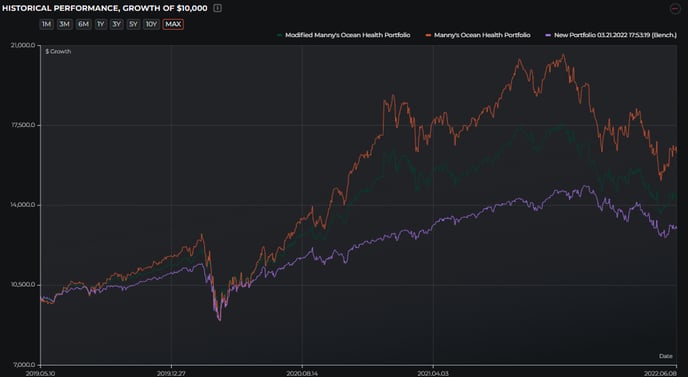
Historical Performance, Growth of $10,000
- Growth of $10,000 based on the historical performance of input and modified portfolios vs. a benchmark ranging from the 1M, 3M, 6M, 1Y, 3Y, 5Y, 10Y, MAX.
Asset Class Breakdown
- Breakdown of the various asset classes contained within both portfolios.

Equity Portfolio - Geography Breakdown
- Geography exposure is for the equity portion of the portfolios only.
- The mapping is based on the country exchange listing. Funds are broken down to their underlying holdings.

Equity Portfolio - Sector Breakdown
- Equity constituents of both portfolios are broken down by sector.

Equity Portfolio - Industry Breakdown
- Equity constituents of both portfolios are broken down by industry.

Equity Portfolio - Market Capitalization Breakdown
- Market Capitalization exposure is for equity single stock listings only. Market Cap classification is based on Logicly cutoffs, calculated daily.

Fixed Income Portfolio - Credit Exposures
- Breakdown by Fixed Income exposure to the various credit ratings for bonds held by either portfolio.

Fixed Income Portfolio - Maturity Exposures
- Breakdown by the various Maturity Exposure time durations for Fixed Income assets held by both portfolios.

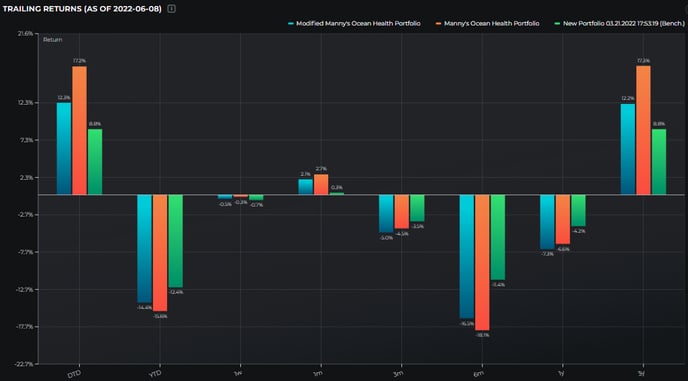
Performance Measures
- Trailing Returns: Entire History, YTD, 1W, 1M, 3M, 6M, 1Y, 3Y
- Calendar Returns: 2019-2022
- Drawdown: Entire History, 2019-2022
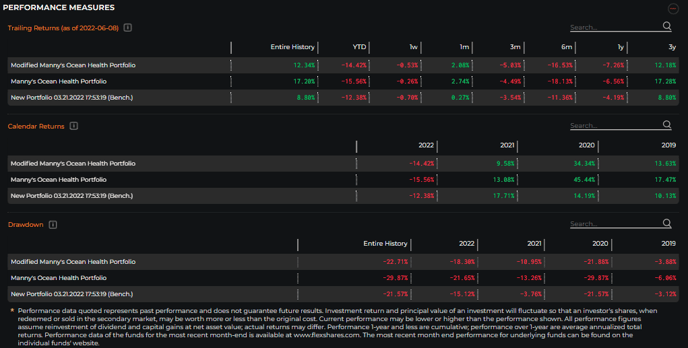
Trailing Returns
- Trailing Returns of both portfolios against the selected benchmark.
- DTD, YTD, 1W, 1M, 3M, 6M, 1Y, 3Y
