Examine quote activity at the top-of-book and at multiple price levels below to understand the on-book liquidity profile of 500+ ETFs by broker.
This article was last reviewed and updated on 12/15/22
Applies to: TMX LOGICLY
Broker Dashboard allows users to examine each broker's book of orders across all venues for each security, and takes measurements each time there is a change in the broker's book.
Using the Tool
1. You can access the Broker Dashboard tool by clicking the icon under Market Data on the homepage, or from the dropdown list on the left side of the platform under Market Data.

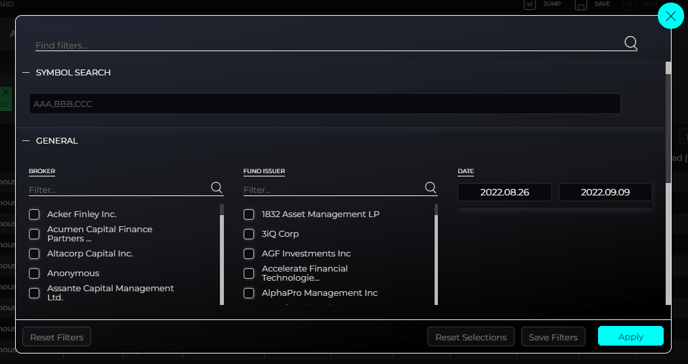
2. Once inside the Broker Dashboard, you can adjust your filters by selecting All Filters or Quick Filters in the top left-hand corner.

3. Filters include:
- Symbol Search
- Time Frame & Market Time
- Fund Issuer
- Broker
- Notional Depth

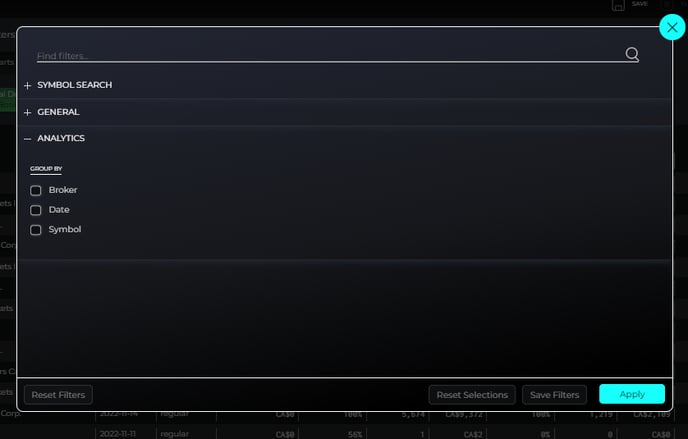
- Group by:
- Broker
- Date
- Symbol

Any filter selections can be saved by clicking Save Filters in the bottom right-hand corner. Once all desired filters are selected, press Apply.
Choosing to utilize one of the Group By filters and then selecting Charts at the top of the page allows you to view a graphical output of book spread. This chart is based on Broker, Date, Symbol or a combination of the 3.

FAQ's
Why is the Quoting percentage absent sometimes?
At ‘Top of Book’ depth - an absent quoting percentage for a broker when Top of Book depth is selected would mean that the broker had no bid / ask volume at any price level during the selected time period. The bid / ask volume and value should similarly be null.
At the $100K / $200K notional drilled depth - an absent quoting percentage for a broker when either of these drilled depth levels means that the broker’s bid / ask quoted value did not exceed in aggregate the drilled depth at any one of the broker’s books snapshots. Despite the absence of a quoting % in such a case, the average of the aggregate bid / ask volume and value for all of the broker’s book snapshots would still be calculated and provided.
Are spreads volume or value-weighted for the purposes of determining spread at the $100K / $200K drilled notional depth levels?
Spreads are measured at the drilled notional depth levels based on the price level at which the notional value was satisfied for each of the bids and ask separately.
For example, if for one of the broker’s books snapshots the broker had $1,000 in value bid at $10.00, $50,000 in value bid at $9.99 and $75,000 in value bid at $9.98, the bid price used for calculating the spread at this snapshot would be $9.98.
Why are the spread metrics absent sometimes?
Spread metrics are only populated if there is a calculable spread for at least 75% of the measured broker book snapshots. The application of this filter is not affected by whether or not a broker’s booked depth has satisfied the notional drilled depth.
Why might there be more than $100K / $200K in value shown for the bid size or ask size when drilling down to those notional depth levels?
The reported volume and value captured at a broker’s book snapshot when drilling down to a notional depth level captures the aggregate quoted bid / ask volume up to and including the price level at which the notional value was breached.
Using the example provided in Question #4 above, the bid value that would be captured in that case would be $126,000 representing the aggregate of the bid volume quoted by the broker up to and including the price level where the broker’s quoted volume satisfied the drilled notional depth in aggregate.
Why might there be less than $100K / $200K in value shown for the bid size or ask size when drilling down to those notional depth levels?
For any single broker book snapshot, the broker’s bid / ask volume will be assessed against the drilled notional depth level. If at any one snapshot, the total sum of the broker’s bid volume across all price levels is less than $100K, the bid price used for determining the spread at the $100K notional drill down level is the broker’s worst bid price.
If a notional value of less than $100K / $200K is reported for a broker for a particular symbol and side, it could have resulted from either of the following:
- At no time (i.e., at none of the broker’s book snapshots over the selected time period) did the broker’s aggregate bid / ask volume exceed the notional drilled depth level. In this case, the quote % for that particular side would be 0%.
- At some of the broker’s book snapshots over the selected time period, the broker’s quoted amount satisfied the notional drilled depth level, but when averaged across its quoted bid size for all of the broker’s snapshots during the selected time period, the effect of a below-threshold total quoted size negatively affected its reported average.
Why might shares/value (on both sides) sometimes increase when we drill down from ‘Top of Book’ to the $100k and $200k notional depth levels?
The example in FAQ #2 above can be used to demonstrate this effect. In that case, the broker’s ‘Top of Book’ bid value for that particular snapshot was $1000 but increased as we aggregate all volume within the price levels needed to satisfy the drilled notional depth level. Even where the average ‘Top of Book’ size reported for the broker is higher than the size available at subsequent levels to meet the next drilled notional depth level (i.e., $100K), an increase in the broker’s average quoted size at the $100K drilled depth level may be observed as a result of this aggregation method.
Are all Canadian trading venues considered?
Assessments are made based on the broker’s attributed quoting activities across all markets other than Omega and Aequitas NEO-N due to data inconsistencies that compromise the accuracy of our analytics.