Create customized simulations for clients across a broad array of portfolio characteristics.
This article was last reviewed and updated on 5/4/23
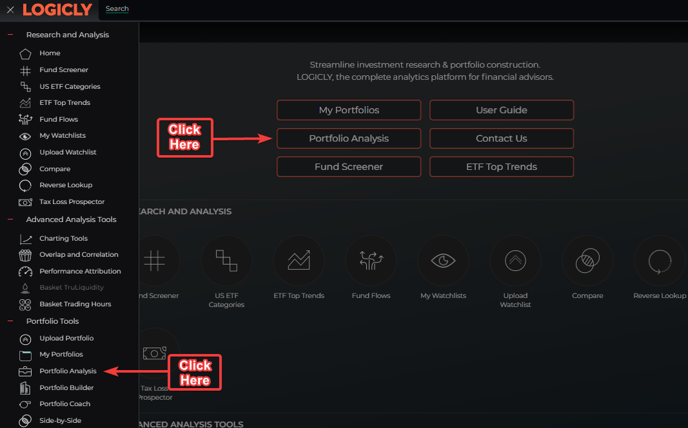
Using the Tool
- Clicking the icon on the Home Page under Portfolio Tools.
- Clicking the Hamburger Icon, scrolling down to Portfolio Tools, and selecting Portfolio Analysis.
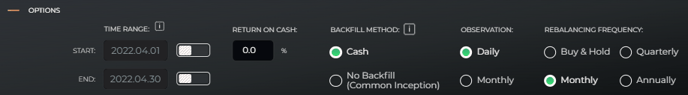
- Time Range: The Start and End Dates of the portfolio.
- Return on Cash: This can be adjusted by %.
- Backfill Method: Choose between Cash or No Backfill.
- Observation Frequency: Choose between Daily or Monthly.
- Rebalancing Frequency: Choose between Buy & Hold, Monthly, Quarterly, or Daily.
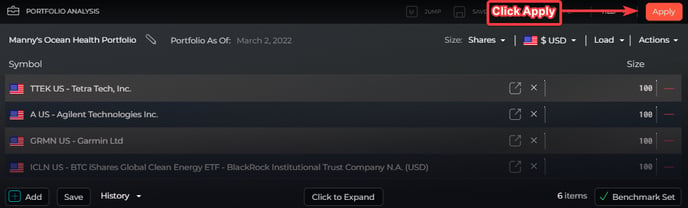
4. When you have your portfolio set and the weights add up to 100%, press th e Apply button in the top right corner.
Exploring the Data & Analytics
Portfolio Analysis DOES backfill when running an analysis. Therefore, historical returns will be of a longer timeframe than what you see in Side-by-Side, where backfilling is NOT used.
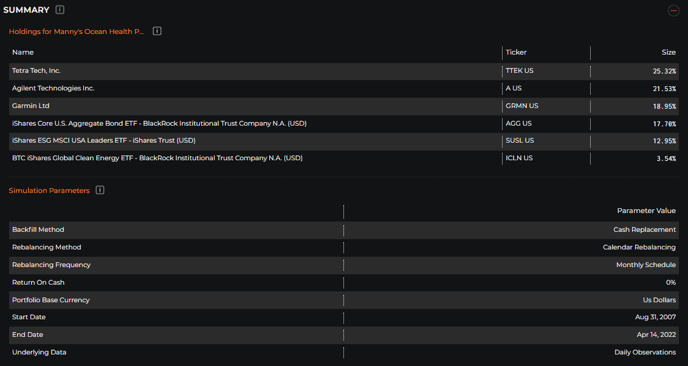
Overview
Portfolio Overview
- Performance Measure based on Trailing Returns
- Risk Estimation based on Annualized Volatility
- Portfolio Costs based on ETF Weighted Expense Ratio

- Holdings - Breakdown of the positions of the last day.
- Simulation Parameter - Recap of parameters used to simulate past performance.
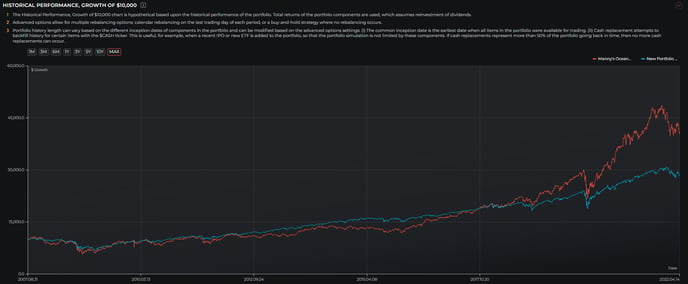
Historical Performance, Growth of $10,000
- Growth of $10,000 based on the historical performance of portfolio and benchmark ranging from the 1M, 3M, 6M, 1Y, 3Y, 5Y, 10Y, MAX.
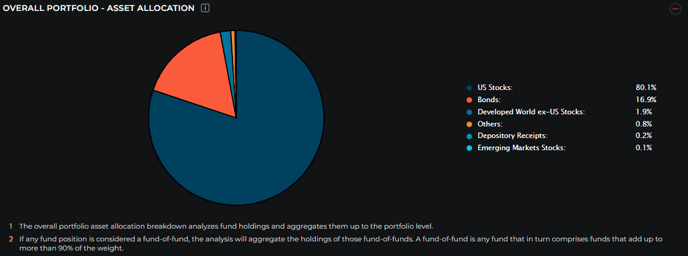
Asset Allocation Breakdown
- The overall portfolio asset allocation breakdown analyzes ETF holdings and aggregates them up to the portfolio level.
- If any ETF portfolio position is considered a fund of funds, the analysis will aggregate the holdings of those fund-of-funds. A fund-of-fund is assumed to be any ETF that is itself comprised of other ETFs by over 90% by weight.
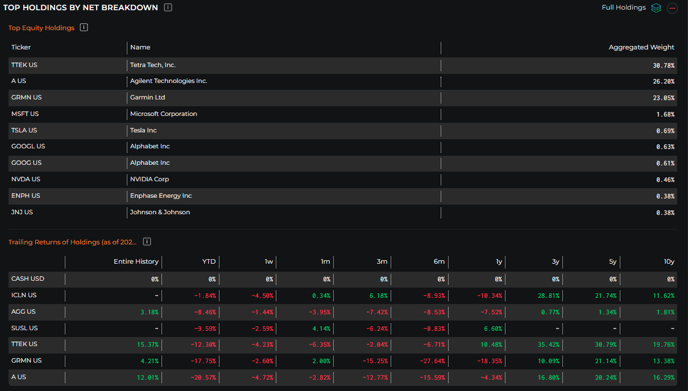
Top Holdings by Net Breakdown
- Top Holdings by Net Breakdown analyzes the top equity holdings held within your portfolio or other constituent funds within your portfolio and aggregates them up to the portfolio level.
- The Trailing Returns of Holdings analyzes the historical individual performance of each portfolio constituent ranging from the Entire History, YTD, 1W, 1M, 2M, 3M, 6M, 1Y, 3Y, 5Y, 10Y.
Performance
Performance Measures
- Overview: Entire History, YTD, 1W, 1M, 3M, 6M, 1Y, 3Y, 5Y, 10Y
- Trailing Returns: Entire History, YTD, 1W, 1M, 3M, 6M, 1Y, 3Y, 5Y, 10Y
- Sharpe & Sortino Ratio: Entire History, YTD, 1W, 1M, 3M, 6M, 1Y, 3Y, 5Y, 10Y

- CAPM Model: Entire History, YTD, 1M, 3M, 6M, 1Y, 3Y, 5Y, 10Y
- Upside/Downside Capture Ratios: Entire History, YTD, 1W, 1M, 3M, 6M, 1Y, 3Y, 5Y, 10Y
- Active Management: Entire History, YTD, 1W, 1M, 3M, 6M, 1Y, 3Y, 5Y, 10Y
- Calendar Returns: 2007-2022
- Drawdown: Entire History, YTD, 1W, 1M, 3M, 6M, 1Y, 3Y, 5Y, 10Y
- The yearly peak to trough returns. We display this return in absolute value. "Drawdown" differs from the "Maximum Drawdown" calculation which is the peak-to-trough followed by a new peak. The Full Drawdown column is the largest peak-to-trough negative return across the entire availability history.

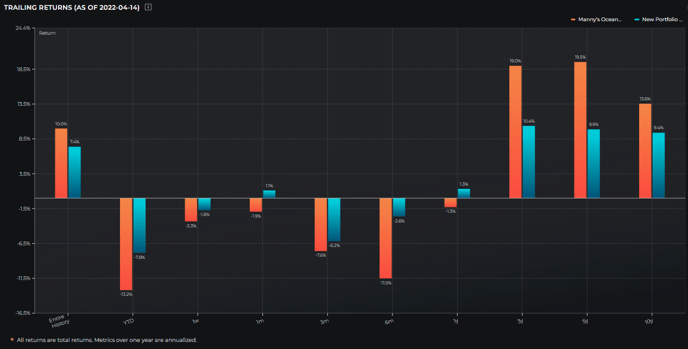
Trailing Returns
- Trailing Returns of the portfolio compared to the benchmark.
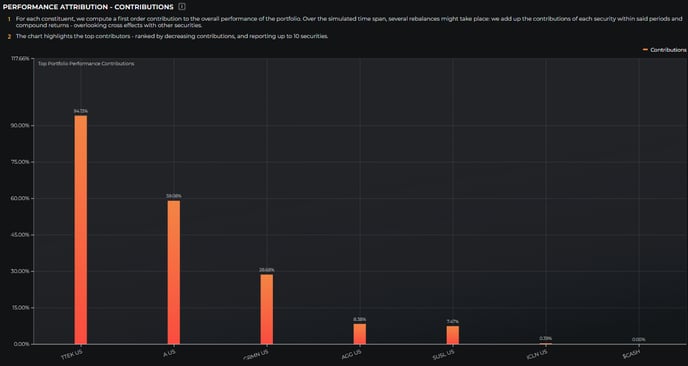
Performance Attribution - Contributions
- For each constituent, we compute a first-order contribution to the portfolio's overall performance. Over the simulated period, several rebalances might take place: we add up the contributions of each security within said periods and compound returns - overlooking cross effects with other securities.
- The chart highlights the top contributors - ranked by decreasing contributions, and reporting up to 10 securities.
Performance Attribution - Active Returns Analysis
A portfolio simulation may include several rebalances which can either be discretionary (based on provided historical portfolio trades) or triggered by the systematic rebalancing options selected. We attribute performance by calculating the Active Return against the chosen Benchmark. Attribution breaks up performance based on Allocation, Selection, and Interaction effects.
- Security Master
- Performance Breakdown by Asset Class Focus
- Performance Breakdown by Investment Strategy

- Performance Breakdown by Geography Focus
- Performance Breakdown by Security Type

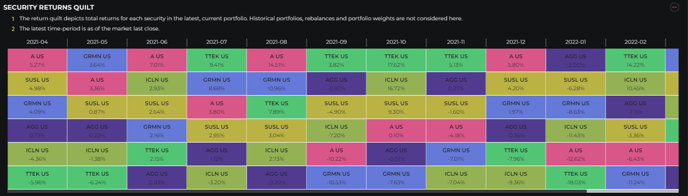
Securities Return Quilt
- The return quilt depicts total returns for each security in the latest, current portfolio. Historical portfolios, rebalances, and portfolio weights are not considered here. The latest time period is as of the market's last close.
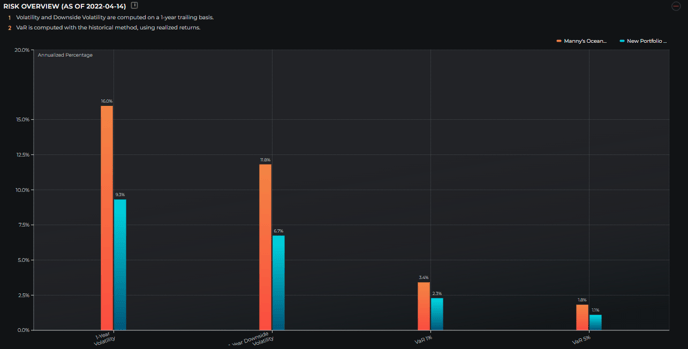
Risk
Risk Overview
- Volatility and Downside Volatility computed on a 1-year trailing basis.
- VaR is computed with the historical method using realized returns.
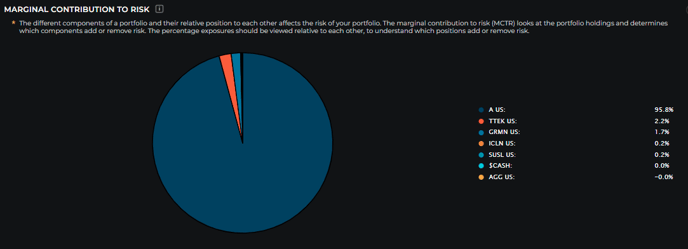
Marginal Contribution To Risk (MCTR)
- The different components of your portfolio and their relative positioning affect the overall risk of your portfolio. The marginal contribution to risk (MCTR) looks at your portfolio holdings and determines which components are adding or removing risk. The percentage of exposures can be used relatively to compare and contrast which positions are the riskiest.
- This is broken down by ticker.
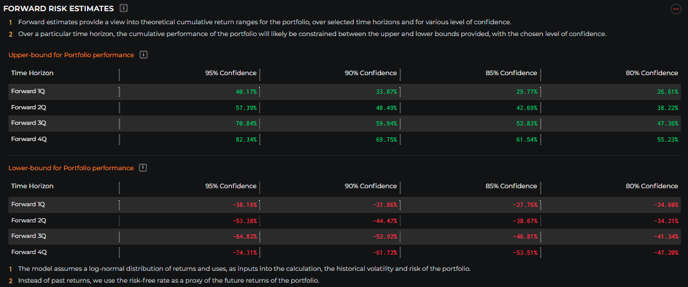
Forward Risk Estimates
- Forward estimates provide a view into theoretical cumulative return ranges for the portfolio, over selected time horizons, and for various levels of confidence. Over a particular time horizon, the cumulative performance of the portfolio will likely be contained between the Upper and Lower bounds provided, with the chosen level of confidence (95%, 90%, 85%, 80%).
- Our model assumes a log-normal distribution of returns and uses the historical volatility and risk of the portfolio as inputs into the calculation. Instead of past returns.
- We use the risk-free rate as a proxy for the future returns of the portfolio.
Risk - Performance Analysis

- The performance of the portfolio and its selected benchmark are analyzed throughout various market cycles.
- The S&P 500 Index (SPX) is used as a proxy for the overall US market and three types of market conditions are identified:
- Bear: where the market is retracing from recently achieved new highs.
- Bull-Recovery: where the market has just exited from a Bear trend and has started recovering from its most recent lows.
- Bull: where the market has recovered from a high-low-high cycle and is now reaching new highs.
- A summary and detailed view of the performance of the portfolio and its benchmark is provided.

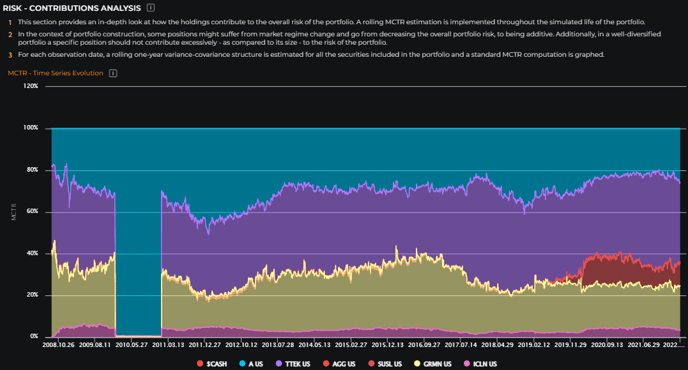
Risk - Contributions Analysis
- This section provides an in-depth look at how the holdings contribute to the overall risk of the portfolio. A rolling MCTR estimation is implemented throughout the simulated life of the portfolio.
- In the context of portfolio construction, some positions might suffer from market regime change and go from decreasing the overall portfolio risk to being additive. Additionally, in a well-diversified portfolio, a specific position should not contribute excessively - as compared to its size - to the risk of the portfolio.
- For each observation date, a rolling one-year variance-covariance structure is estimated for all the securities included in the portfolio and a standard MCTR computation is graphed.
Cost
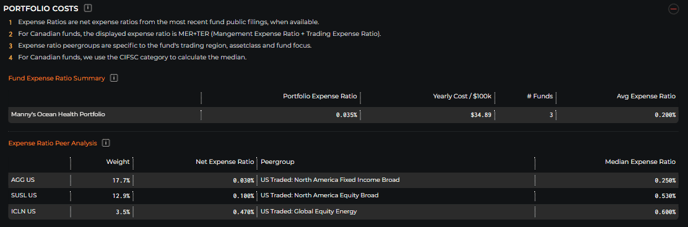
Portfolio Costs
- Costs associated with US-listed ETFs included in the portfolio.
- Comparison versus Peers: For each ETF held with its peer group median expense ratio.
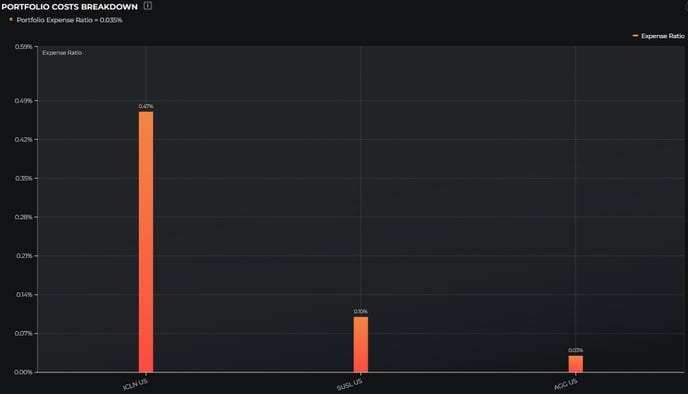
Portfolio Costs Breakdown
- Decomposition of the costs associated with the ETFs held within the portfolio.
Net Exposure
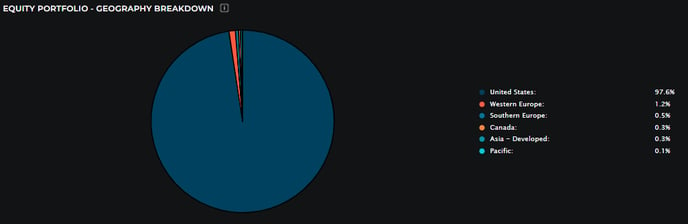
Equity Portfolio - Geography Breakdown
- Geography exposure is for the equity portion of the portfolio only.
- The mapping is based on the country exchange listing. Funds are broken down to their underlying holdings.
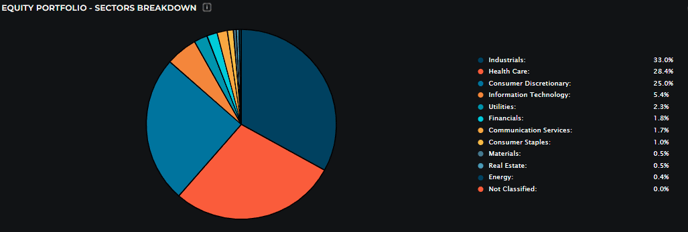
Equity Portfolio - Sectors Breakdown
- Portfolio is broken down by sector.
Equity Portfolio - Market Cap Breakdown
- Market Capitalization exposure is for equity single stock listings only. Market Cap classification is based on Logicly cutoffs, calculated daily.

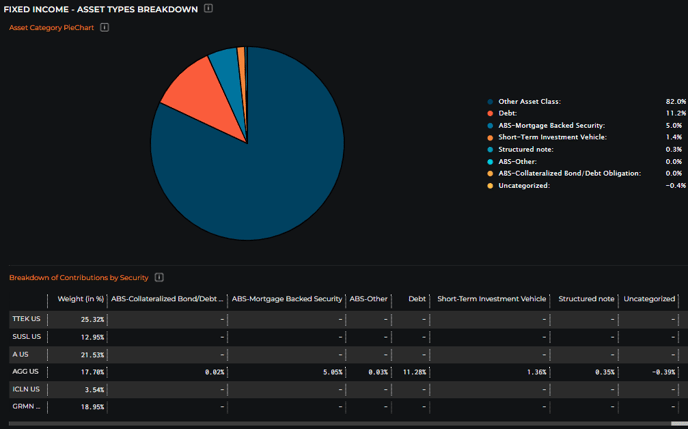
Fixed Income - Asset Types Breakdown
- Breakdown of Fixed Income-focused baskets by the asset type.
Fixed Income - Issuer Types Breakdown
- Breakdown by the type of issuer for Fixed Income assets held in the funds.

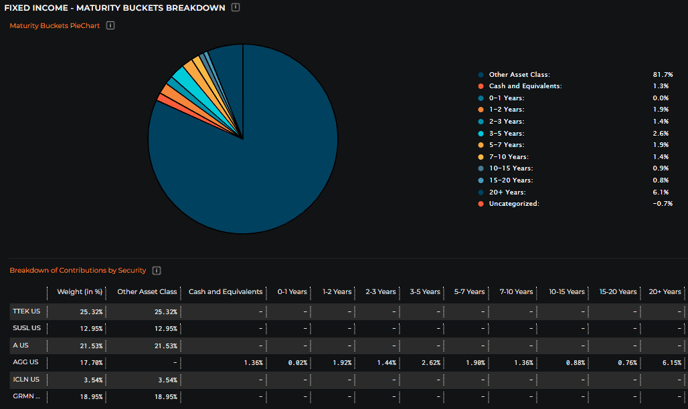
Fixed Income - Maturity Buckets Breakdown
- Breakdown by the various Maturity Exposure time durations for Fixed Income assets held.
Fixed Income - Credit Ratings Breakdown
- Breakdown by Fixed Income exposure to the various credit ratings for bonds.
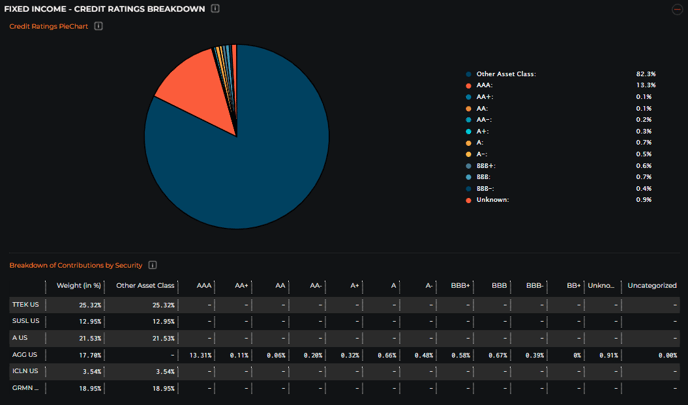
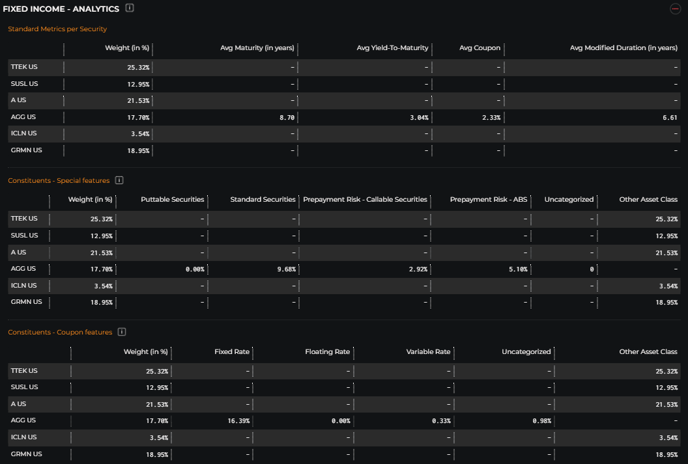
Fixed Income - Analytics
- Standard Fixed Income metrics for the analysis of the portfolio.
Risk vs Performance
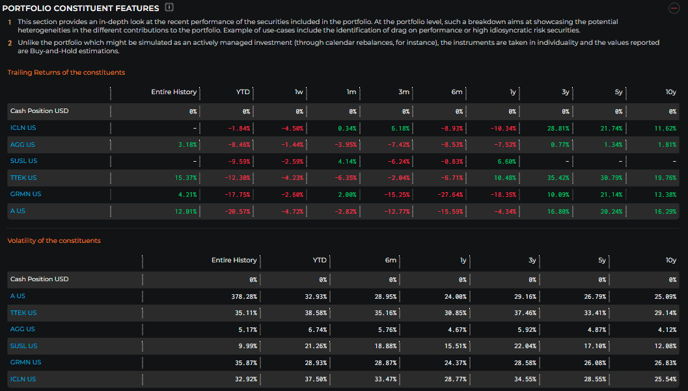
Portfolio Constituent Features
- This section provides an in-depth look at the recent performance of the securities included in the portfolio. At the portfolio level, such a breakdown aims at showcasing the potential heterogeneities in the different contributions to the portfolio. Examples of use-cases include the identification of drag-on performance or high idiosyncratic risk securities.
- Unlike the portfolio which might be simulated as an actively managed investment (through calendar rebalances, for instance), the instruments are taken in individuality and the values reported are Buy-and-Hold estimations.
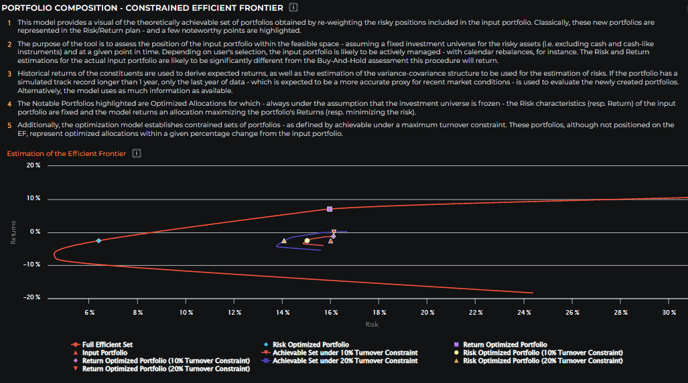
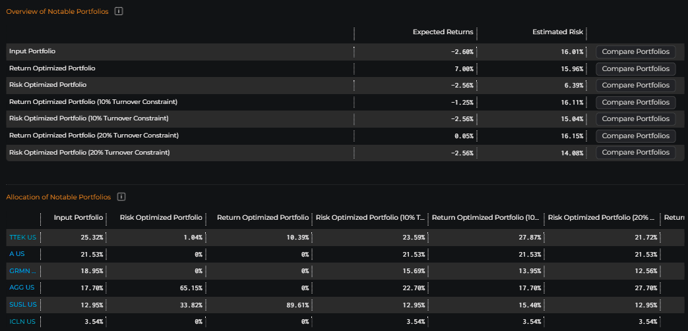
Portfolio Composition - Constrained Efficient Frontier
This model provides a visual of the theoretically achievable set of portfolios obtained by re-weighting the risky positions included in the input portfolio. Classically, these new portfolios are represented in the Risk/Return plan - and a few noteworthy points are highlighted.
- The purpose of the tool is to assess the position of the input portfolio within the feasible space - assuming a fixed investment universe for the risky assets (i.e. excluding cash and cash-like instruments) and at a given point in time. Depending on the user's selection, the input portfolio is likely to be actively managed - with calendar rebalances, for instance. The Risk and Return estimations for the actual input portfolio are likely to be significantly different from the Buy-And-Hold assessment this procedure will return.
- Historical returns of the constituents are used to derive expected returns, as well as the estimation of the variance-covariance structure to be used for the estimation of risks. If the portfolio has a simulated track record longer than 1 year, only the last year of data - which is expected to be a more accurate proxy for recent market conditions - is used to evaluate the newly created portfolios. Alternatively, the model uses as much information as available.
- The Notable Portfolios highlighted are Optimized Allocations for which - always under the assumption that the investment universe is frozen - the Risk characteristics (resp. Return) of the input portfolio are fixed and the model returns an allocation maximizing the portfolio's Returns (resp. minimizing the risk).
- Additionally, the optimization model establishes constrained sets of portfolios - as defined by achievable under a maximum turnover constraint. These portfolios, although not positioned on the EF, represent optimized allocations within a given percentage change from the input portfolio.
Overview & Allocation of Notable Portfolios
Factors
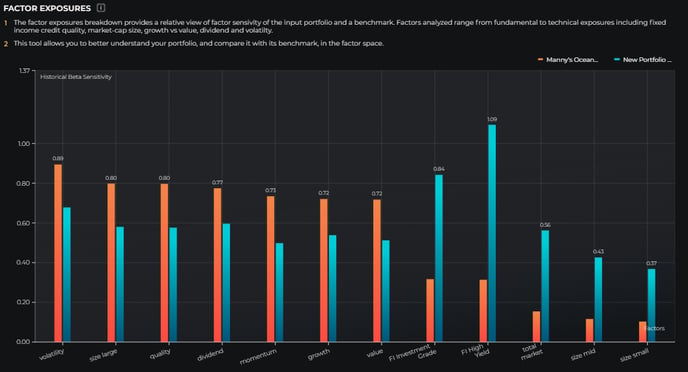
Factor Exposures
- The factor exposures breakdown provides a relative view of factor sensitivity of the input portfolio and a benchmark.
- Factors analyzed range from fundamental to technical exposures including fixed income credit quality, market-cap size, growth vs value, dividend, and volatility.
- This tool allows you to better understand your portfolio, and compare it with its benchmark, in the factor space.
Scenarios
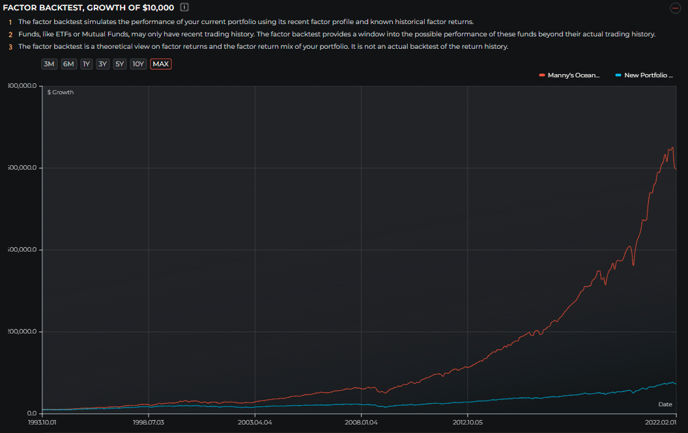
Factor Backtest, Growth of $10,000
- The factor backtest simulates the performance of your current portfolio using its recent factor profile and known historical factor returns.
- Funds, like ETFs or Mutual Funds, may only have a recent trading history. The factor backtest provides a window into the possible performance of these funds beyond their actual trading history.
- The factor backtest is a theoretical view of factor returns and the factor return mix of your portfolio. It is not an actual backtest of the return history.
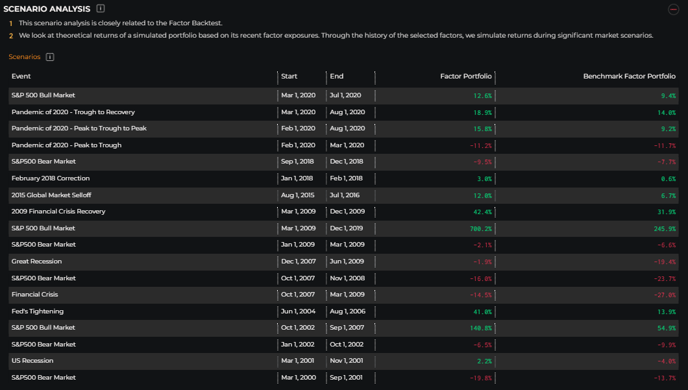
Scenario Analysis
- This scenario analysis is closely related to the Factor Backtest.
- We look at theoretical returns of a simulated portfolio based on its recent factor exposures.
- Through the history of the selected factors, we simulate returns during significant market scenarios.
ESG
- ESG Scoring is based on Arabesque S-Ray metrics. These ESG metrics are provided on individual stocks. Logicly aggregates these scores up to the portfolio level. In addition, the portfolio is screened for ESG Warning Flags. Here, we look at the largest underlying equity positions which may cause potential ESG conflicts. You can learn more about the S-Ray Methodology here. Also, click here to learn more about the Warning Flags (called Preference Filters in S-Ray).
- ESG Scoring is based on Arabesque S-Ray metrics. These ESG metrics are provided on individual stocks. LOGICLY aggregates these scores up to the portfolio level. In addition, the portfolio is screened for ESG Warning Flags. Here, we look at the largest underlying equity positions which may cause potential ESG conflicts.
ESG Features
- Portfolio ESG Scores - Portfolio ESG Scores are rated from 1 to 100 through the S-Ray Methodology. The ESG Score is broken down into aggregate scores based on Environmental, Social, and Governance focuses. These three scores averaged together equal the combined Environmental, Social, and Governance Score.
- ESG Warning Flags Overview - Calculations for the aggregate weights of various ESG Warning Flags.
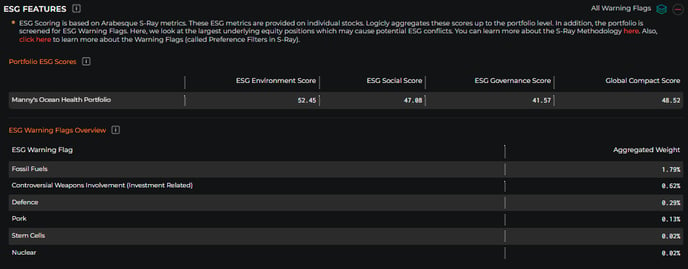
- Top ESG Warning Flags by Weight - This is based on the ESG Warning Flags at the constituent level of the ETF.

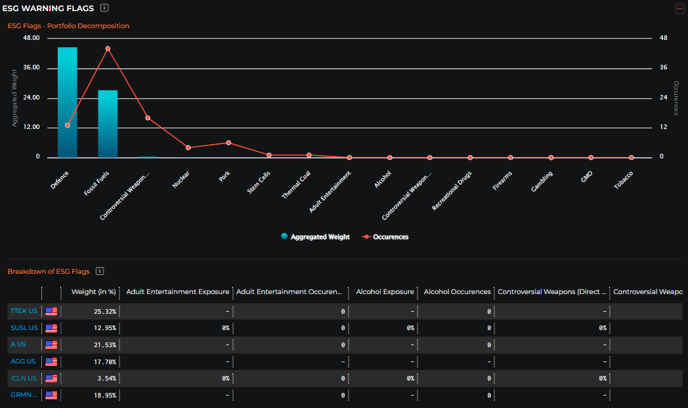
ESG Warning Flags
- Breakdown of ESG Warning Flags by portfolio constituent.
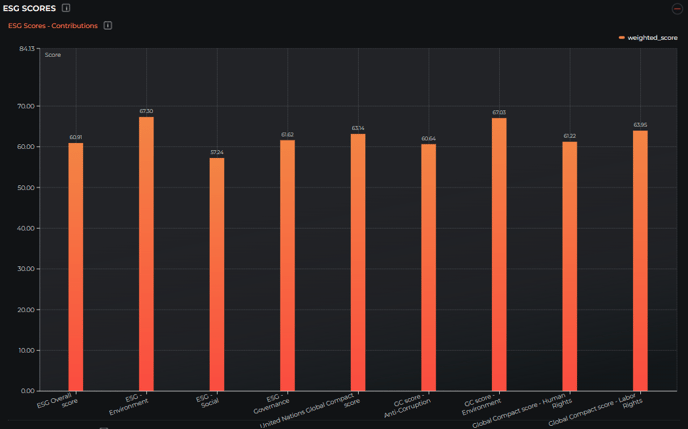
ESG Scores
- ESG Scores - Contributions: Analysis of the different contributions to the overall ESG score of the portfolio.
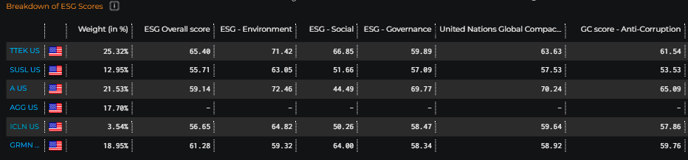
- Breakdown of ESG scores by constituent: Weighted contribution to ESG for each security included in the portfolio.
Income
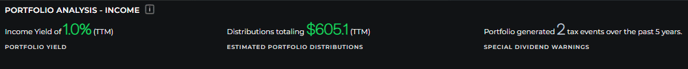
Portfolio Analysis - Income
- Key Metrics for income drawn from the inputted portfolio.
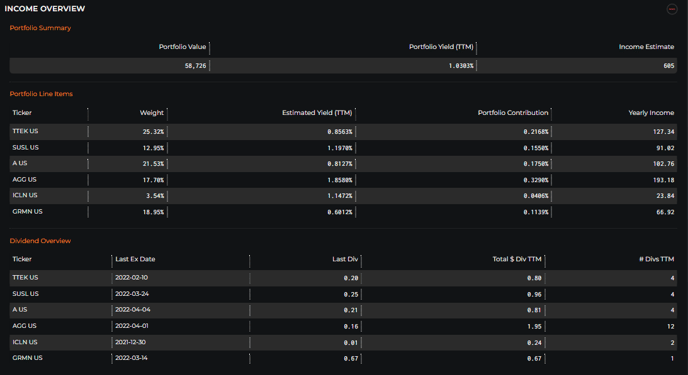
Income Overview
- Portfolio Income breakdown by:
- Summary of Portfolio Yield
- Line item yield contribution of portfolio constituents
- Line item Dividend Overview of portfolio constituents.
- Special Dividend Warnings

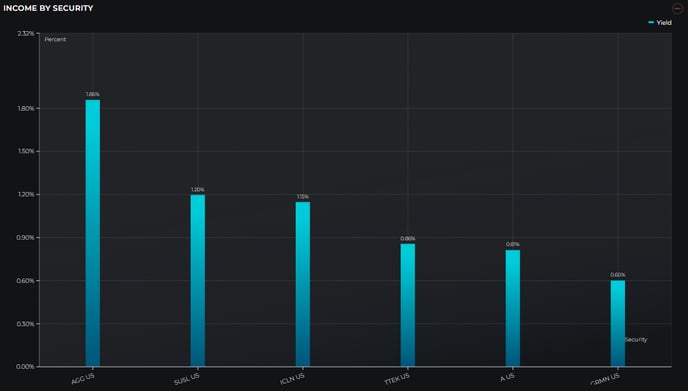
Income by Security
- Yield percentages by constituent are displayed graphically.
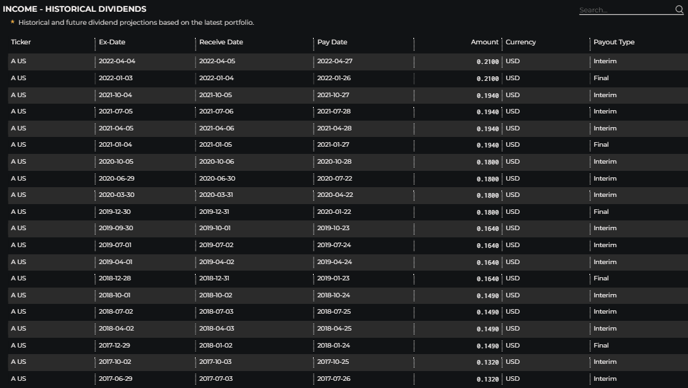
Income - Historical Dividends
- These are Historical and future dividend projections based on the latest portfolio. You can find data on Ex-Date, Dividend Amount, and Payment Type here.
Other
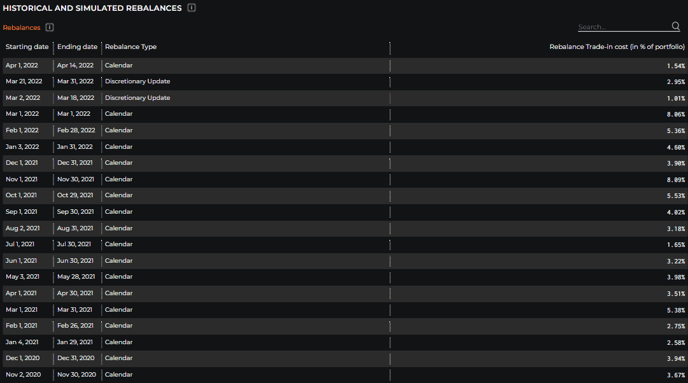
Historical and Simulated Rebalances
- Overview of the rebalances that happened over the simulated life of the portfolio.
Best Performers Intra-Period

Worst Performers Intra-Period
