Candlestick and bar charts of ETFs and stocks.
This article was last reviewed and updated on 5/4/23
Using the Tool
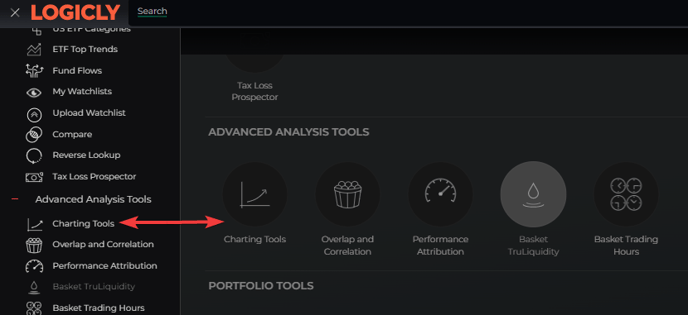
You can access the Charting Tools by clicking the icon on the home page, or by selecting the Hamburger Icon drop-down list on the left side of the platform, under Advanced Analysis Tools.

1. Create or load a list of securities using the list tool. There is a toggle button at the top labeled Portfolio and Watchlist. Choosing Portfolio will run the charting tools as a single portfolio, while Watchlist will allow a user to compare a list of stocks or funds against each other.

2. Optionally select asset return buckets, using the Asset Options form.

3. Press the Apply button.

Exploring the Data & Analytics
Advanced Charting
You can compare the total returns of each security of the following time periods:
- 1M
- 3M
- 6M
- YTD
- 1Y
To go into further detail you can find out the following information about a security for any trading session:
- Daily High
- Daily Low
- Daily Open
- Daily Close

Securities Return Quilt
- The return quilt depicts total returns for each security in the latest, current portfolio. Historical portfolio rebalances, and portfolio weights are not considered here.
- The latest time period is as of the last market close.
