Compare two portfolios or funds against one another.
This article was last reviewed and updated on 5/4/22
The Side By Side tool opens up the entire portfolio in order to provide basket level statistics. All costs included in the calculation are: create costs, redeem costs, regional transactions fees and taxes as well as LOGICLY's own market impact estimate costs. Comparison will be performed on all ETF positions within your starting end ending portfolios. You can add, manage, and remove positions from your LOGICLY portfolios for any symbol type, when the Side by Side Analysis is running, non-ETF Symbols will be filtered from the results when applied.
These analytics are similar to those in our Portfolio Analysis tool, but Side-by-Side allows you to look at that data compared between multiple securities or portfolios.
Using the Tool
To get started with Side-by-Side:
1. Go to the upper Main Menu and click Side-by-Side.

2. Select a Saved Portfolio or Create a New One:
- Press Actions and click on New
- Find and add securities to the the list through the search functionality and Add button.
- Adjust the percentages to your desired weightages and ensure they add up to 100%.
- Or to assign equal weightages to each portfolio click the Set Equal button.
- Customize your benchmark by pressing the Set Benchmark and assigning it to any ticker in the LOGICLY Database, or by Clicking the Link: Create new benchmark portfolio in My Portfolios.
- Press Actions and click on Upload.
- Upload it via .CSV document (Be sure to follow formatting guidelines presented in the window.)
3. When you have your first portfolio set, go through the same steps for the portfolio you want to compare the first one too.

Options
4. If you want to go further, you can customize the Options (The "+" sign below the 2nd portfolio) for your Side-by-Side such as:
- Return on Cash: This can be adjust by %.
- Observation Frequency: Choose between Daily or Monthly.
- Rebalancing Frequency: Choose between Buy & Hold, Monthly, Quarterly, or Daily.

5. Press the Apply button.

Exploring the Data & Analytics
Side-by-Side does NOT backfill when running comparison. Therefore, historical returns will be of a shorter timeframe than what you will find in Portfolio Analysis, where backfilling IS used.
You will be able to compare the two portfolios by various criteria through the following grids:
Summary
Holdings
- Breakdown of the positions of the last day
Simulation Parameter
- Recap of parameters used to run the simulation of past performance


Comparison Table
- The comparison of the constituents across both portfolios being put Side-by-Side.

Historical Performance
- Growth of $10,000 based on historical performance of portfolio and benchmark ranging from the: 1M, 3M, 6M, 1Y, 3Y, 5Y, 10Y, or MAX timeframes.

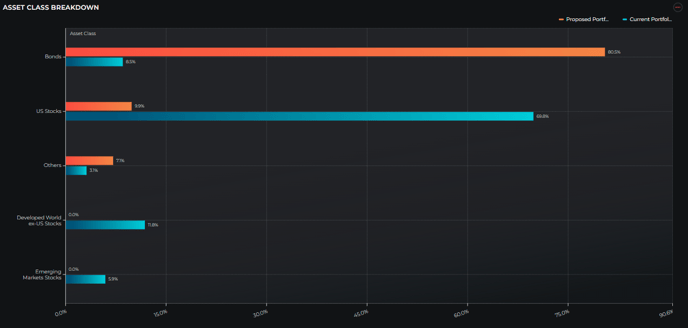
Asset Class Breakdown
- The overall portfolio asset allocation breakdown analyzes ETF holdings and aggregates them up to the portfolio level.
- If any ETF portfolio position is considered a fund-of-funds, the analysis will aggregate the holdings of those fund-of-funds. A fund-of-fund is assumed to be any ETF that is itself comprised of other ETFs by over 90% by weight.
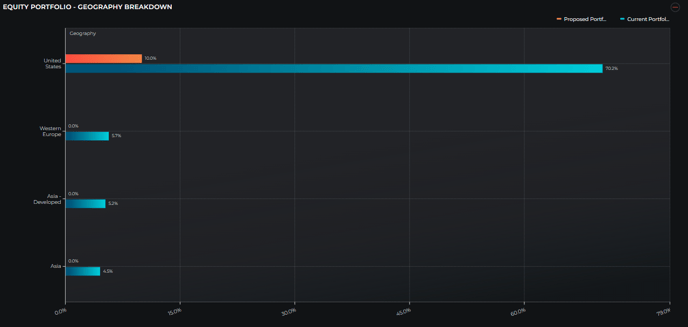
Equity Portfolio - Geography Breakdown
- Geography exposure is limited to the equity portion of the portfolio.
- The mapping is generally based on the country exchange listing.
- ETFs are broken down to the underlying holdings. Ex: China H-Share Class securities trading in Hong Kong are classified under China exposure.
Equity Portfolio - Sector Breakdown
- Sector Breakdown analyzes portfolio exposure across the various sector exposures in the Equity markets.

Equity Portfolio - Industry Breakdown
- The Industry Breakdown analyzes the portfolio exposure across the various industries equities can be categorized under.

Equity Portfolio - Market Capitalization Breakdown
- Market Capitalization exposure is limited to the equity portion of the portfolio. Market Cap bucket classification is based on LOGICLY cutoffs which are calculated on a daily basis.

Fixed Income Portfolio - Bond Types
- This table in the Side-by-Side breaks down Fixed Income holdings across both portfolios by the various types of Bonds.

Fixed Income Portfolio - Credit Exposures
- This table in the Side-by-Side breaks down Fixed Income holdings across both portfolios by their exposures to the various Credit Ratings on the market.

Fixed Income Portfolio - Maturity Exposures
- This table in the Side-by-Side breaks down Fixed Income holdings across both portfolios by their exposures to the various time durations for maturation of the bonds held.

Performance Measures
- Summary
- Trailing Returns
- Calendar Returns
- Drawdowns: The yearly peak to trough returns. We display this return in absolute value.
"Drawdown" differs from the "Maximum Drawdown" calculation which is the peak-to-trough followed by a new peak. The Full Drawdown column is the largest peak-to-trough negative return across the entire availability history.

Trailing Returns
- Trailing Returns of the portfolio compared to the benchmark.

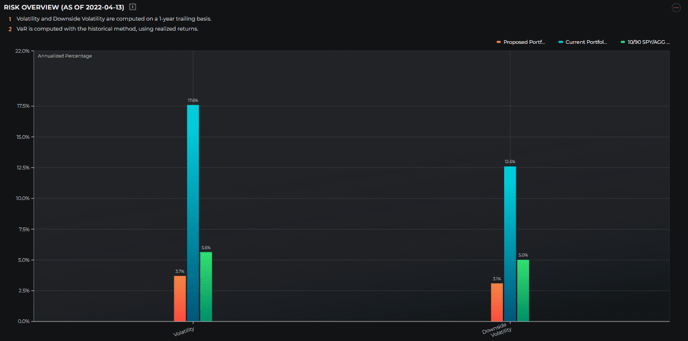
Risk Overview
- Volatility and Downside Volatility computed on a 1-year trailing basis.
- VaR is computed with the historical method using realized returns.
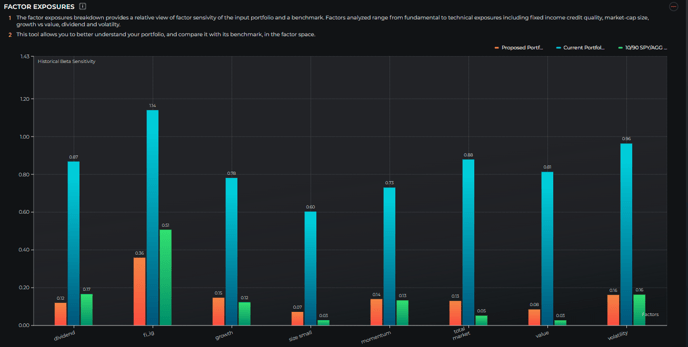
Factors Exposure
- Factors analyzed range from fundamental to technical exposures including fixed income credit quality, market-cap size, growth vs value, dividend and volatility.
- This tool allows you to better understand your portfolio, and compare it with its benchmark, in the factor space.
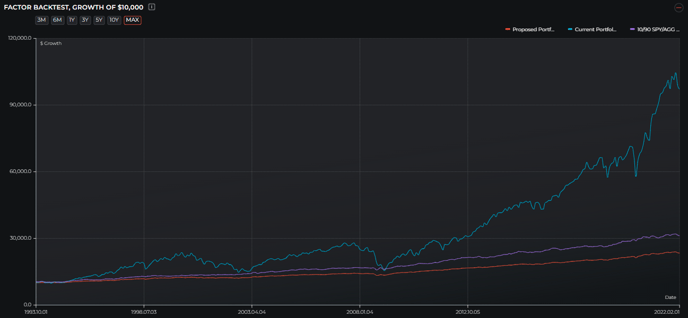
Factor Backtest, Growth of $10,000
- The factor backtest tool looks back at the historical evolution of your current portfolio, using its recent factor 'profile' and the history of returns for classical factors.
- Many ETFs have a short trading history. The factor backtest provides a window into the possible performance of these funds beyond their actual trading history.
- The factor backtest is a theoretical view on factor returns and the factor return mix of your portfolio. It is not an actual backtest of the return history.
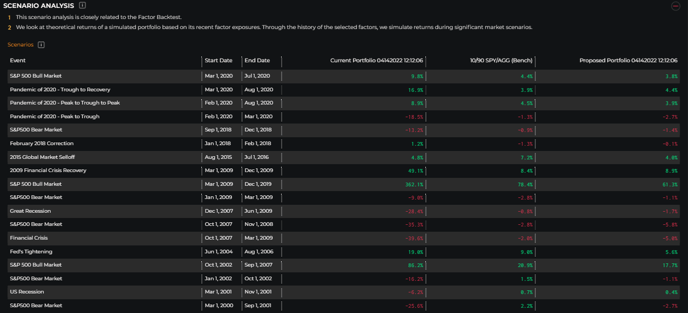
Scenario Analysis
- This scenario analysis is closely related to the Factor Backtest.
- We look at theoretical returns of a simulated portfolio based on its recent factor exposures.
- Through the history of the selected factors, we simulate returns during significant market scenarios.
