Portfolio Coach makes it easy for an advisor to scale out their portfolio models to more clients in an easy and efficient manner.
This article was last reviewed and updated on 6/7/23
Use Cases
- Connect as many portfolios as you need to the Portfolio Coach, with a growing number of integrations.
- Continuously monitor and get alerts on any investment policy item you care about. These include but are not limited to:
- Risk and Volatility
- Return Threshold
- Tax Alpha Opportunities
- Income and Yield
- ESG Metrics and Warning Flags
- Create Portfolios of US ETFs, Mutual Funds, and Single Stocks, and run "what if" scenarios against your investment policies.
- Create Customized Portfolio Policies and connect them to portfolios
- Deep dive into policy details and understand which positions are helping or hurting. For example, see which positions are the biggest return drivers or contributors to risk.
- Get suggestions for enhancing policy items. For example, find lower-cost funds are available that match your risk exposure
- Generate trade lists from the Coach. Customize which trades you want to approve and which you reject.
- Generate an audit trail on every decision made in your portfolio. Pinpoint those decisions down to specific policy suggestions from the Coach: (ie: risk-reducing, yield-enhancing, asset allocation rebalancing, etc..)
Using the Tool
Portfolio Coach's various features and data are broken down into 4 sections inside the tool:
- Overview
- Alerts
- Holdings
- Portfolio List
Overview
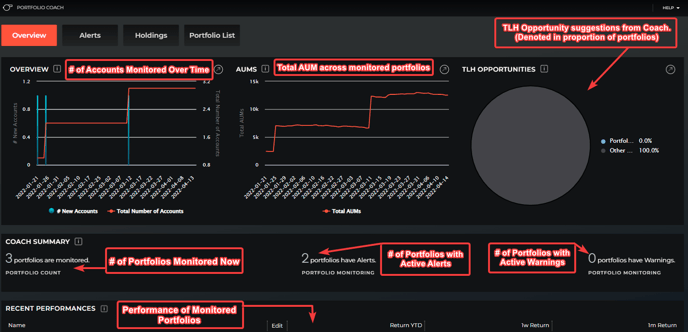
When you first open the Portfolio Coach (PC) you are greeted by our Overview page. Here, you will find the following metrics:
- Overview - Number of new accounts vs Total Number of accounts monitored by PC over time.
- AUMs - Total AUM across all portfolios/households monitored by PC over time.
- TLH Opportunities - Percentage of portfolios monitored by PC with TLH suggestions.
- Coach Summary - Number of Portfolios that are actively monitored by PC, have active alerts from PC, or have active warnings from PC.
- Recent Performances - YTD, 1-week, and 1-month returns on each portfolio or household being monitored by PC.
Alerts
After exploring the Overview page and noticing that PC is alerting you about one of your portfolios or households, click on the Alerts box on the top left of the tool.
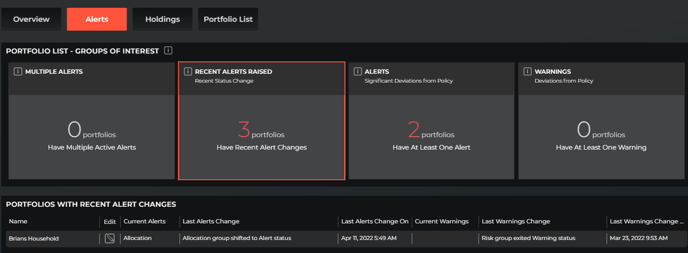
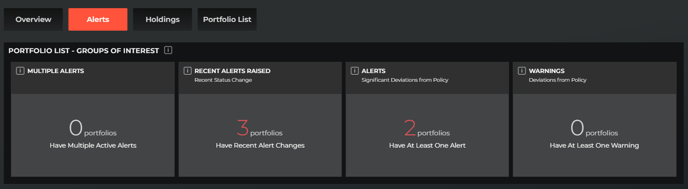 The four boxes on this page are interactive. If you were to click on the Recent Alerts Raised box in the screenshot above, a table generates below showing the details of your alerts.
Holdings
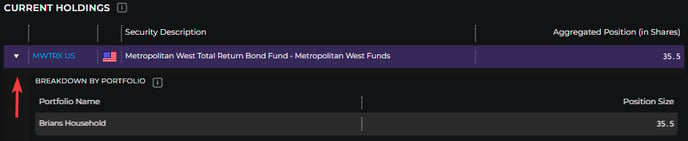
The next section of Portfolio Coach is the Holdings tab. Here you will find the current holdings across all households and portfolios that are being monitored by the Coach. These holdings are listed as an Aggregated Position in shares.
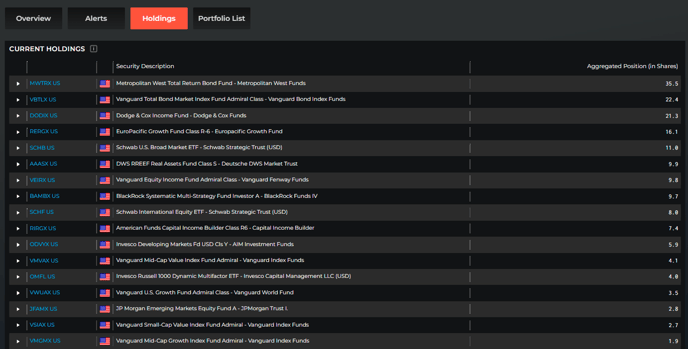 If you would like to see what portfolios or households a holdings aggregated position is a part of, just click the triangle to the left of the fund's ticker to see the breakdown by portfolio.
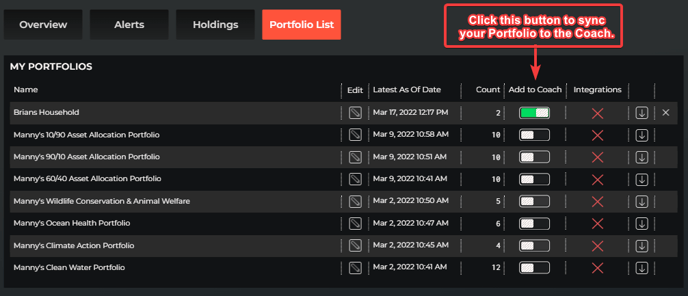
Portfolio List
The last section of Portfolio Coach the Portfolio List. This is a direct feed to the My Portfolios section of the platform. To add any of your portfolios or households to the Coach, simply click the slider button next to the line item under the Add to Coach column.
Portfolio Details
Clicking on a monitored portfolio in either the Overview or Portfolio List pages will take you to portfolio details for the selected portfolio inside of the Coach.
Once inside the portfolio, you will see the current asset allocation in pie chart form on the left side. In addition to the allocation chart, you are met with the Investment Policy Statement (IPS) settings that dictate the alerts and warnings generated by Portfolio Coach.
Here you are able to adjust IPS settings for the respective portfolio and also monitor how the portfolio is doing relative to it's individual settings.
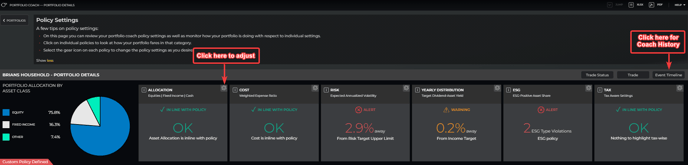 There are 6 criteria and settings that Portfolio Coach uses to monitor and alert on portfolios:
- Allocation
- Cost
- Risk
- Income
- ESG
- Tax
When any of the elements tied to the IPS of a portfolio stray from the target beyond the acceptable deviations a warning or an alert will be triggered by Portfolio Coach.
- Warnings = The item is nearing deviation from the targe but is still slightly within range.
- Alerts = The item has deviated from the target beyond the acceptable range.
To adjust any of the IPS settings, select the 'gear' icon located in the top right corner of each setting's card. By clicking on the card itself, you will be brought to a Portfolio X-Ray for the respective IPS setting.
To view the history of IPS alerts and adjustments for a portfolio, select the 'Event Timeline' button to view the trail of warnings, alerts, and changes made.
Allocation
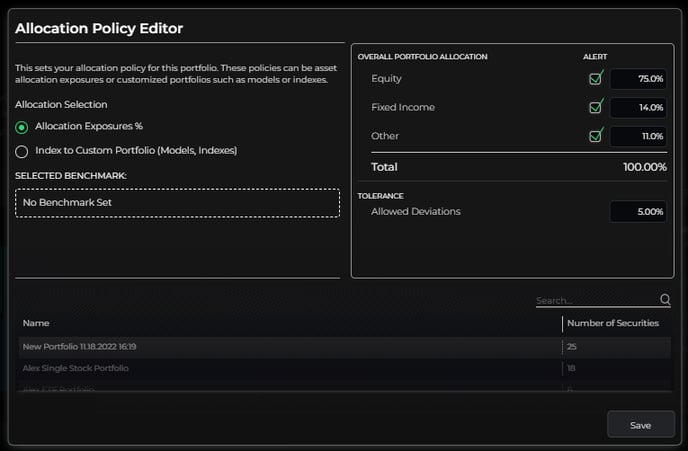
Under the Allocation Policy Editor you are able to select the desired allocation exposures for a given portfolio based on risk tolerance or it's respective model/benchmark.
You can also set the tolerance for allowed deviations in asset allocation. In this instance of the screenshot above, an alert will go out to the advisor when this portfolio's allocation deviates more than 5% from the IPS.
If you opt for the allocation exposure percentages, you also have the ability to select which asset classes in particular you want to be alerted on when deviation occurs by selecting or unselecting the Alert checkbox.

If you click on the Allocation card inside Portfolio Details, you will see the above Portfolio X-Ray for Allocation. You will be shown a summary of the current allocation settings accompanied by an allocation breakdown of the selected portfolio.
Cost
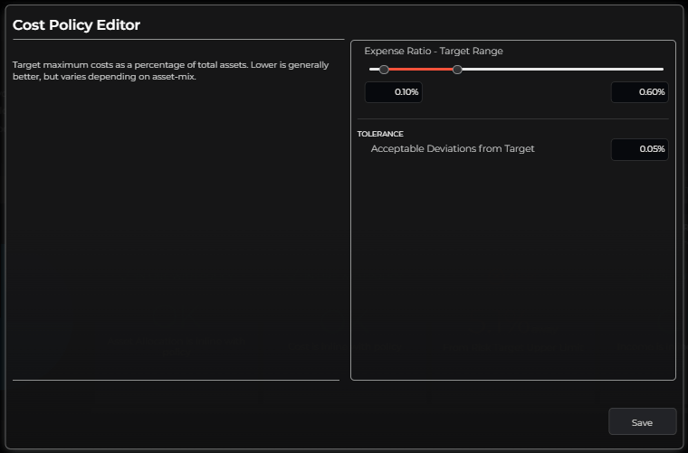
Under the Cost Policy Allocator you are able to set the desired target range for maximum portfolio costs as a percentage of the total assets within a portfolio. This range can be as small or as large as you'd like.
Beyond the target range, you can also dictate the acceptable deviations from the target range in this section.
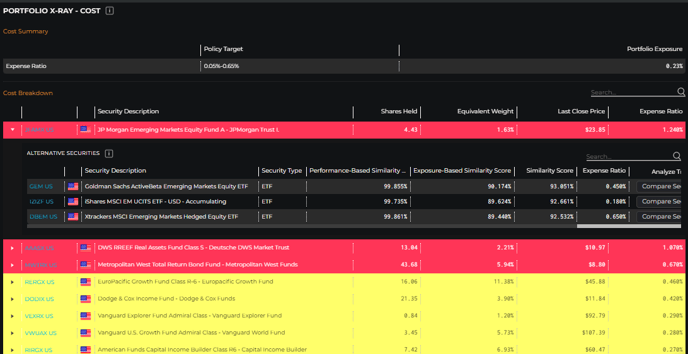 If you click on the Cost card inside Portfolio Details, you will see the above Portfolio X-Ray for Cost. You will shown a summary of the current cost settings accompanied by a breakdown of holding costs within the selected portfolio.
If a fund's expense ratio is above the policy target, it will be highlighted in red on this screen. If a fund's expense ratio is near the upper limit of the policy target, it will be highlighted yellow on this screen.
By clicking the triangle icon to the left of the highlighted line item you will be shown a list of suggested alternative securities based on Similarity Score that have expense ratios within your target.
You can click the Compare Securities button next to a suggestion to break out into a Side-by-Side comparison of the original fund and it's prospective replacement.
Risk
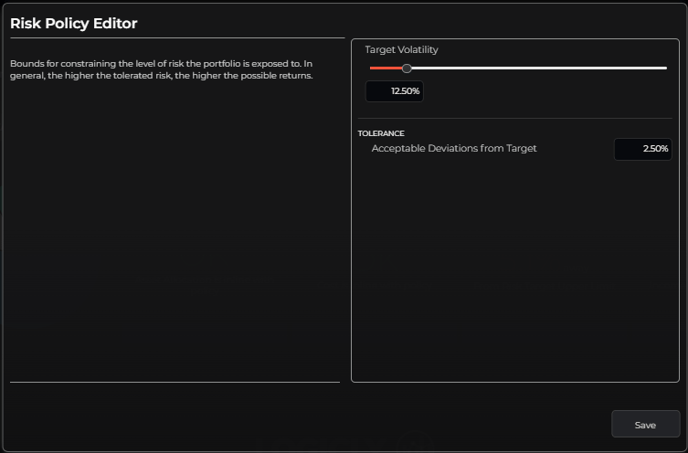
Under the Risk Policy Editor you can the target volatility for the selected portfolio. This parameter is based off of total risk level that the portfolio is exposed to.
Beyond the target volatility, you can also dictate the acceptable deviations from the target range in this section.
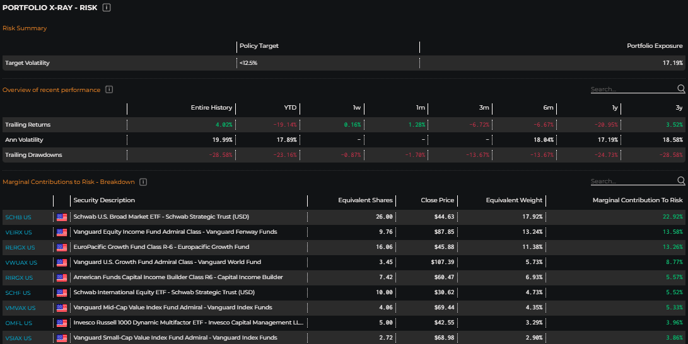
If you click on the Risk card inside Portfolio Details, you will see the above Portfolio X-Ray for Risk.
You will shown a summary of the current risk settings accompanied by an overview of recent portfolio performance in addition to a Marginal Contributions to Risk breakdown for the portfolio.
Income
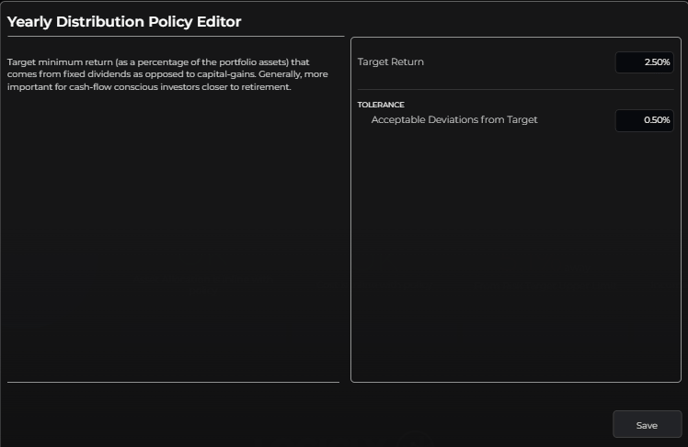 Under the Yearly Distribution Policy Editor you can set the target minimum return that comes from fixed dividends of assets held within the portfolio.
Beyond the target return, you can also dictate the acceptable deviations from the target return in this section.
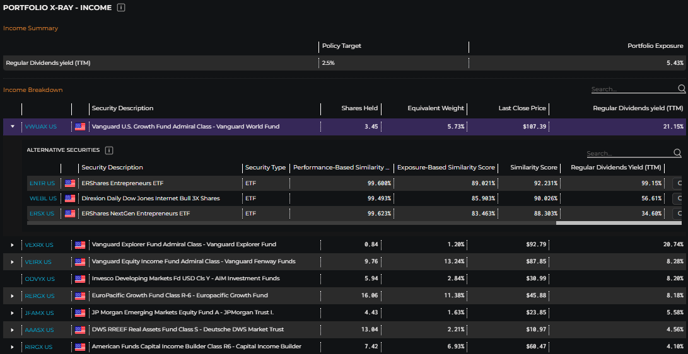
If you click on the Income card inside Portfolio Details, you will see the above Portfolio X-Ray for Income.
You will be shown a summary of the current income settings accompanied by an income breakdown for the selected portfolio.
If a fund's income is below the policy target, it will be highlighted in red on this screen. If a fund's income is near the lower limit of the policy target, it will be highlighted yellow on this screen.
By clicking the triangle icon to the left of the highlighted line item you will be shown a list of suggested alternative securities based on Similarity Score that have income within or above your target. You can click the Compare Securities button next to a suggestion to break out into a Side-by-Side comparison of the original fund and it's prospective replacement.
ESG
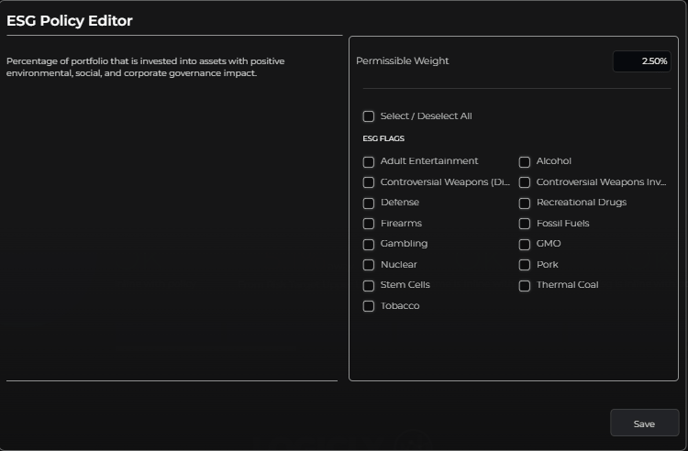 Under the ESG Policy Editor you can dictate the permissible weight of assets within the portfolio that have exposure to ESG warning flag sectors or industries.
To get even more granular, you can select which specific ESG flags you do and do not want to be alerted on relative to portfolio exposure.
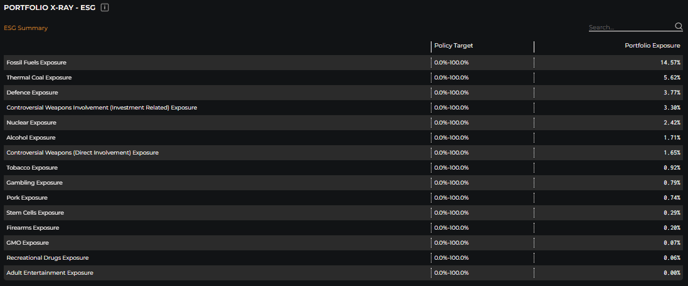
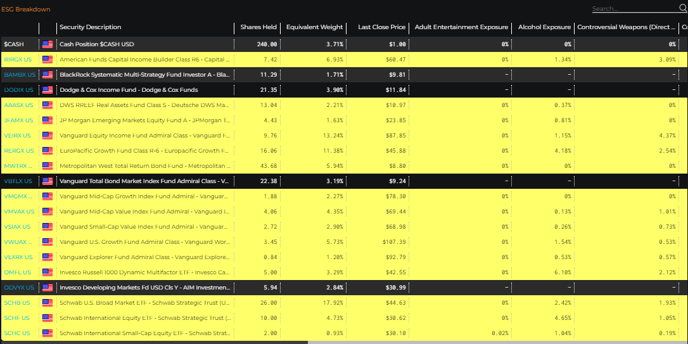
If you click on the ESG card inside Portfolio Details, you will see the above Portfolio X-Ray for ESG.
You will be shown a summary of ESG Exposure within the selected portfolio in addition to a breakdown of which constituents are contributing to the ESG warning flags. Those funds with exposure to ESG warning flags will be highlighted yellow on the screen.
Tax
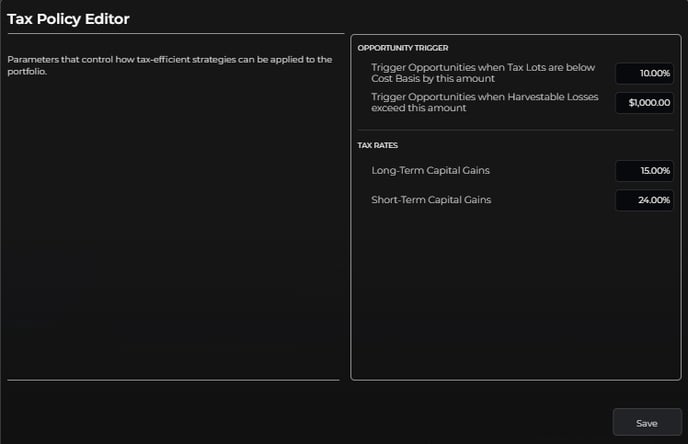 Under the Tax Policy Editor you can dictate the parameters controlling how tax-efficient strategies are identified and applied to the given portfolio.
You can select the bounds of percentage amount below cost basis that tax lots need to be to trigger an opportunity, as well as the size of the harvestable loss desired to trigger an opportunity.
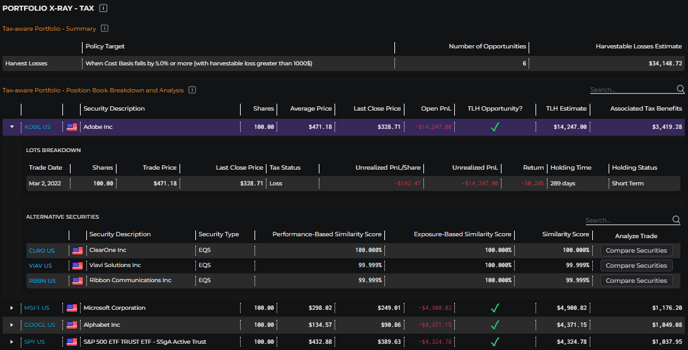
If you click on the Tax card inside Portfolio Details, you will see the above Portfolio X-Ray for Tax.
You will be shown a summary of the current Tax Aware settings within the selected portfolio that contains the number of opportunities and dollar amount of harvestable losses.
In addition, Portfolio Coach shows a Position Book Breakdown and Analysis for each constituent within the portfolio. If an opportunity is available, there will be a check mark under 'TLH Opportunity?'.
For those constituents, click on the triangle icon to the left of the line item to be shown a lot breakdown of the holding and see a list of suggested alternative securities based on Similarity Score that can potentially be traded into to lock in the associated tax benefit.
You can click the Compare Securities button next to a suggestion to break out into a Side-by-Side comparison of the original fund and it's prospective replacement.